
How To Create Jira Dashboards — And 6 Reasons It’s Not Enough
Step-by-Step Guides: How To Create Jira Dashboards, Reports and Gadgets — And 6 Reasons Why They Might Just Not Be Enough | Previously Published to Propelo.AI
Engineering leaders need to stay ahead of the data. They need to be aware of the bigger picture while gaining an in-depth knowledge of each and every factor plaguing teams along the way. Data must be accurate — the closer to real-time, the better. Data must be purposeful — sometimes, the smallest details cause the greatest impact.
What are Jira dashboards?
Jira is a fully-scalable workflow management tool designed for agile environments, with scrum, Kanban and large-scale Scrum (LeSS) capabilities. It makes the work of project and product development teams much easier, faster and more efficient.
So, what are they used for?
While it was originally created as a bug and issue tracker, the platform quickly evolved for data gathering, reporting and analysis, as well as for requirements and test case management, making it easier for teams to collaborate, with over 20 reports on one dashboard combined.
Jira was created exclusively for the software developer and engineer, especially those who may be working on various projects simultaneously. Its easy-to-use system dashboard is displayed by default on the platform’s “homepage” location and can be shared between project teams working throughout the organization.
The platform also offers a number of estimation methods, dynamic content and visualization. Users can easily create reports and add Jira dashboard gadgets that provide different views of each project.
With Jira’s no-code data pipeline, users can automate the validation, cleanup, and loading of customer data — without writing even a small portion of code — which means that skilled project managers don’t need to worry about the lack of coding abilities while successfully leading technical projects beyond the finish line.
Powerhouse teams, however, require more speed, more transparency and a whole lot of control over the tools, roles and metrics they use every day. That’s why Jira, on its own, is largely inadequate when managing large to medium teams in the enterprise arena. And while it’s still an excellent tool for planning and tracking purposes, it should only be used in tandem with an external platform like Propelo.
At the same time, Jira can track project-related milestones and progress with a series of tools and metrics, including:
- Release planning
- Sprint planning
- CI/CD integrations
- Status of live production
- Issue management
- Code control
- Project Backlog
- Jira service management
- Feature flagging
- Developer tool integrations
- Code scrolling in Dark Mode
- Version control
Let’s take a look at the benefits of adding Jira to your current tech stack and what it means for teams who pride themselves on insight.
Jira for Software Development Teams
Jira makes it easier to collaborate with stakeholders and leadership on a project-by-project basis, allowing granular access depending on role, department or hierarchy. The platform also makes it easier to manage budgets, times and resources, providing the tools that teams need for the planning and execution of high-level projects and continued availability.
From day one of the software development lifecycle (SDLC), teams can establish transparency, creating operable roadmaps and implementing various tools for the continuous integration and continuous delivery (CI/CD) of software projects.
Jira has included quite a few critical features synonymous with agile project management, including:
- Release planning
- Sprint planning
- CI/CD integrations
- Status of live production
- Issue management
- Code control
- Project Backlog
- Jira service management
- Feature flagging
- Developer tool integrations
- Code scrolling in Dark Mode
- Version control
Jira Software for DevOps Teams
According to Atlassian, creator of the Jira workflow management platform, “DevOps is a set of practices that works to automate and integrate the processes between software development and IT teams so that they can build, test, and release software faster and more reliably.”
The DevOps template itself has been designed for high-performing teams so that they may save time when developing quality software products and reduce errors throughout the development cycle.
Several projects can be directed into a single dashboard, allowing developers to keep track of more than one project at a time.
Jira’s collection of gadgets and reports provides users with a streamlined view of the status and updates of software projects. And although it’s easy to monitor multiple projects in one central dashboard location, users can also organize their projects, assignments, and achievements in different charts within the data-driven project management platform itself.
Traditionally, developers would be forced to flip between several different platforms and dashboards on a daily basis. But with all critical data in one centralized dashboard location, this is no longer a problem. Data can be combined for a more universal view of various projects across the organization.
Jira Software also integrates with existing DevOps tools, helping teams deliver better software faster and with a focus on the best practices strategies in:
- Software developers
- Automation
- Testing & Security
- Observability
- Feature Flagging
- Continuous Delivery and Deployment
Although automation does exist with Jira, there are still several processes that must be carried out manually, whether that means transferring data in and out of apps, marking various processes with an updated status or moving parts of the project along to the next steps.
We still need to input metrics, switch between programs that carry out specific tasks, migrate data between platforms and program each platform for those different tasks.
The time it takes to both gather and maintain a well-curated database and program Jira to do many of these tasks, even at a basic level, is equivalent to employing two-to-four full-time engineers at a mid-sized organization.
Jira for Requirements and Test Case Management
Teams are starting to develop more iteratively, and Jira is quickly becoming the central hub for coding, collaboration, test management and release. For this, many add-ons have become available, allowing users to seamlessly provide quality assurance (QA) at every step of the SDLC and give QA teams a reason to adopt Jira more regularly.
QA teams use Jira issues, customized screens, fields and workflows to manage manual and automated tests — both of which could benefit from understanding the difference between a Jira dashboard and a board.
Jira dashboards operate as a “heads-up” view of what’s most important to the user and will likely be an overview of everything he or she is working on — individually or as a team. On the other hand, a board is, as described by idalko, “for reviewing and manipulating individual issues and passing them from one stage to another.”

When it comes to Jira, boards are often considered centralized hubs for task management capabilities, where various tasks are mapped onto customizable workflows and assessed by project management teams. As a result, they provide users with a heightened sense of transparency, highlighting critical information relating to particular areas of the project scope — while they also focus on gathering and visualizing data relating to the team dynamic, software development lifecycle (SDLC) and timeline progression.
The platform is often well-received due to its onboard time-tracking capabilities and real-time performance reports, which include burn-up and burn-down charts, sprint reports and velocity mapping. Onboard tools and gadgets also enable productivity, allowing project managers to closely monitor their teams and customize this data over time.
Data can be monitored between sprints to help teams determine velocity and other factors that can inhibit progress if not planned or appropriately addressed.
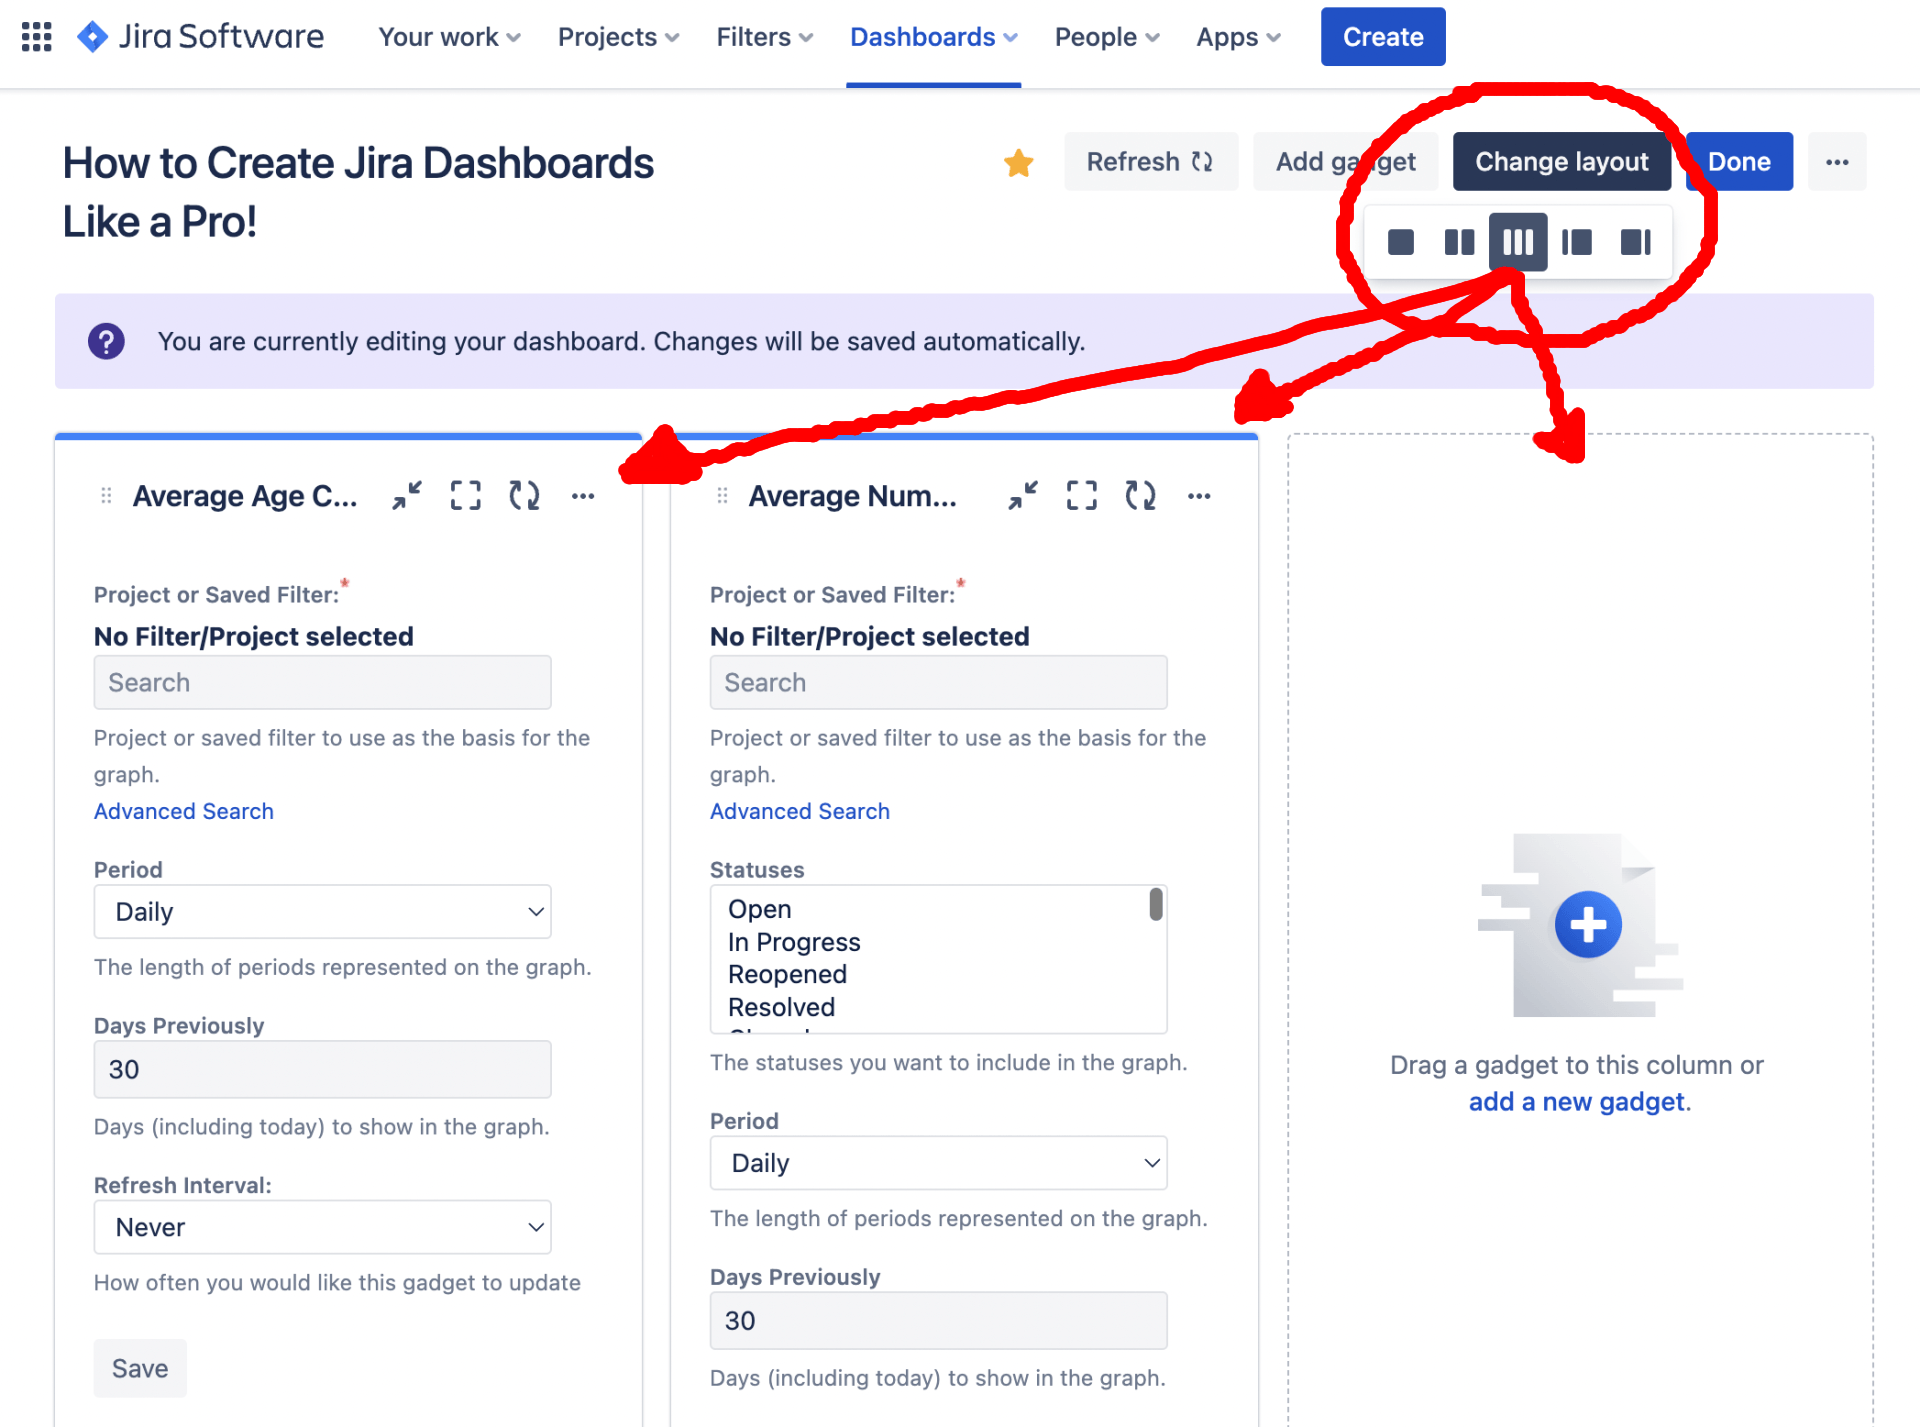
The Jira dashboard layout is easily changed. Columns can be added based on a need for organization. By default, gadgets can be added and reordered across several columns on the dashboard. Because up to 20 different gadgets can be viewed at once, multiple columns can be configured. It is only suggested, however, that six Jira dashboard gadgets be added for improved visibility. So the number of columns would be at the preference of the end-user.
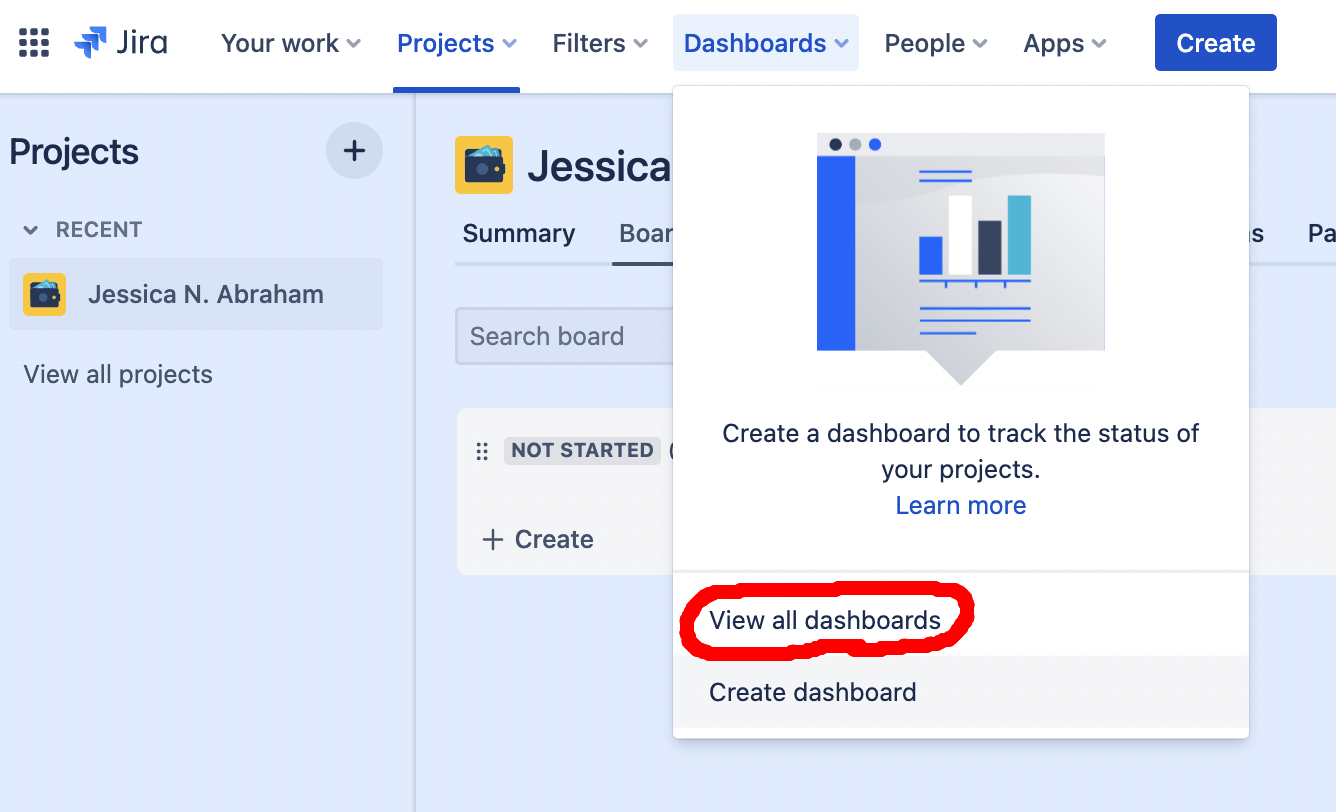
To view all dashboards:
- Navigate to “Dashboards”
- Click on “View all Dashboards”
Atlassian suggests that every new project should get a new dashboard, citing that it’s perfect for visualization. And quite frankly, it allows project management teams to track time, spot bottlenecks, assign tasks and track progress rather quickly and accurately.
Jira is the perfect data-driven project management tool for software developers and engineers because it allows users to focus on their efficacy and improve as a whole as they collaborate on each project, from the start until finish.
Each new dashboard sheds light on where the project has been and where it might be going over time. The Jira sprint health gadget, for example, sheds light on the most critical metrics associated with project development between sprints.
The agile sprint burndown gadget, however, tracks data associated with ongoing sprints in order to predict whether or not tasks will be completed on time. Each gadget is associated with its own dashboard report that often depicts the ideal scenario for executing tasks and issues from the start of each sprint until the end date.
Dashboards allow users to track and monitor projected release dates for several versions, taking control when necessary to save a project from falling behind.
To set up a new Jira dashboard, users must start with the system dashboard and customize the dashboard to include what’s most essential.
While some don’t consider Jira the perfect project management tool, others use it on a daily basis — even integrating its tools with external databases.
What is a Jira dashboard report?
For project management teams who quickly need a way to scan their projects before making tough decisions, the Jira dashboard report feature can save them a lot of time. Most reports are explicitly designed with the end-user in mind. This means that product owners and managers, in particular, will find that the tools are needed to visually track and identify whether their projects align with the business’s goals. And each new dashboard can help them maintain the entirety of the scope.
Dashboards allow users to spot, identify and mitigate issues before they ever truly become a problem. By tracking their data visually, managers can determine the progress of each project to decide which aspects are going well and which aspects could be improved.
In fact, visualization makes it easier for businesses to translate raw data into actionable insight as project managers gather key information related to ongoing projects and business-related needs. Metrics include vital data pertaining to past performance, project benchmarks and the continued goals of the software development team.
Jira’s dashboard reporting system was created for both agile and Kanban management styles. This includes Scrum and LeSS for large-scale software development. This is extremely important for software development teams, which are not only focused on the projects they develop but also on how they improve as a unit.
What are the types of reports in Jira?
There are quite a few different types of reports that can be created in Jira. These reports give users a real-time overview of their team’s performance in each phase of the software development lifecycle.
For almost every type of iteration, Jira has a report available for customization. Several reports can be found directly on the platform, but users can create their own from scratch or download user-generated reports on the Atlassian Marketplace.
For the most part, however, built-in dashboard reports in Jira are categorized into four basic types, which include:
- Jira Agile Reports
- Jira Issue Analysis Reports
- Jira Forecast and Management Reports
- Jira Custom Reports
Jira reports are built upon JQL queries — the Jira Query Language, considered the most powerful and flexible way to search for issues in Jira, using Jira’s service management toolbar. It’s a proprietary issue-tracking product developed by Atlassian that allows bug tracking and agile project management.
Some of the reports offered by Jira, broken down by category:
Agile Reports for Kanban Teams
- Cumulative flow diagram
- Control chart
Agile Reports for Scrum Teams
- Sprint Report
- Burndown Chart
- Burnup Chart
- Epic Report
- Epic Burndown
- Release Burndown
- Version Report
- Velocity Chart
Other Reports
- Workload Pie Chart Report
- And, of course, customizable reports
Reports for Forecast and Management
- Time Tracking Report
- User Workload Report
- Version Workload Report
Reports for Issue Analysis
- Average Age Report
- Created vs. Resolved Issues Report
- Pie Chart Report
- Recently Created Issues Report
- Resolution Time Report
- Single Level Group By Report
- Time Since Issues Report
Reports for DevOps
- Cycle Time Report
- Deployment Frequency Report
How do I create a dashboard in Jira?
While some may feel overwhelmed initially, they’ll soon find out that setting up dashboards in Jira is easy. First, they’ll need to choose a Jira dashboard layout from a library. Dashboards display only the information we need, and only a Jira admin can customize the default system dashboard.
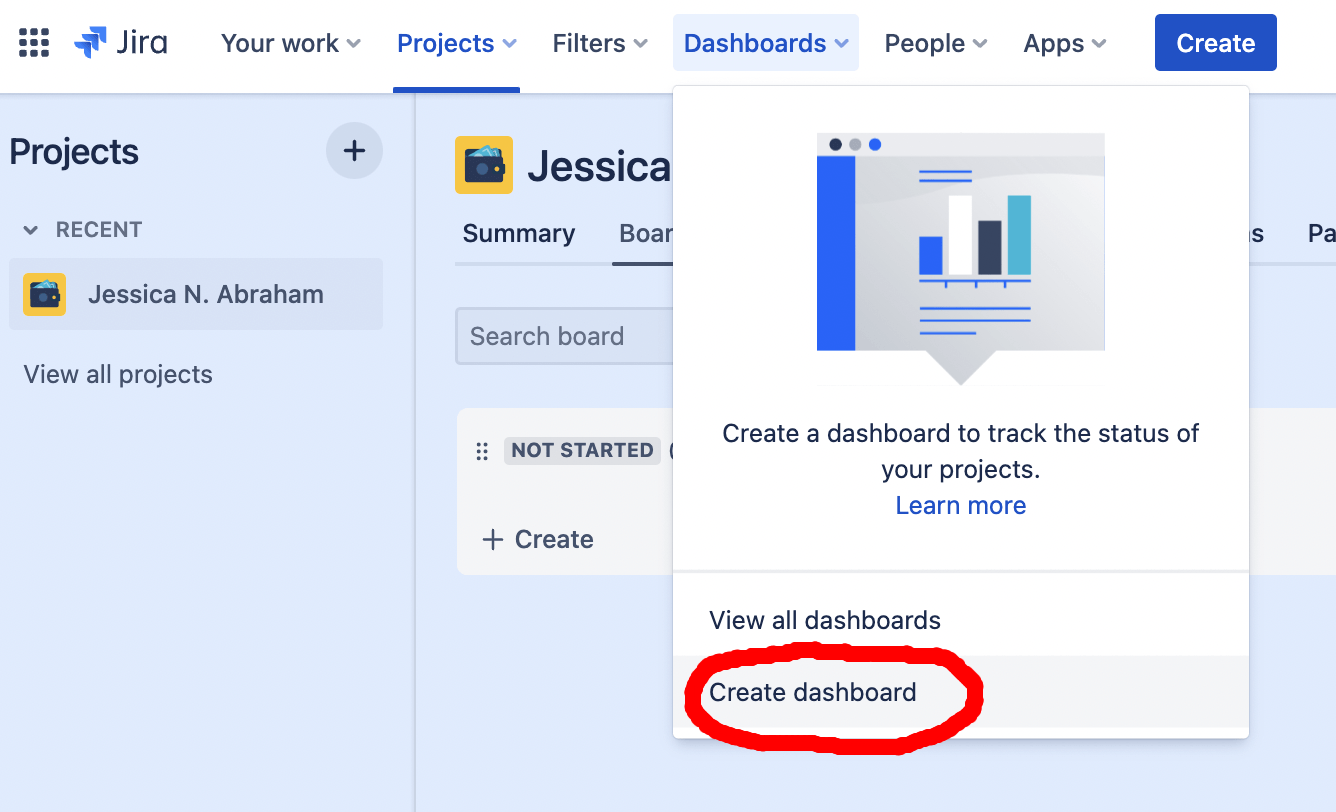
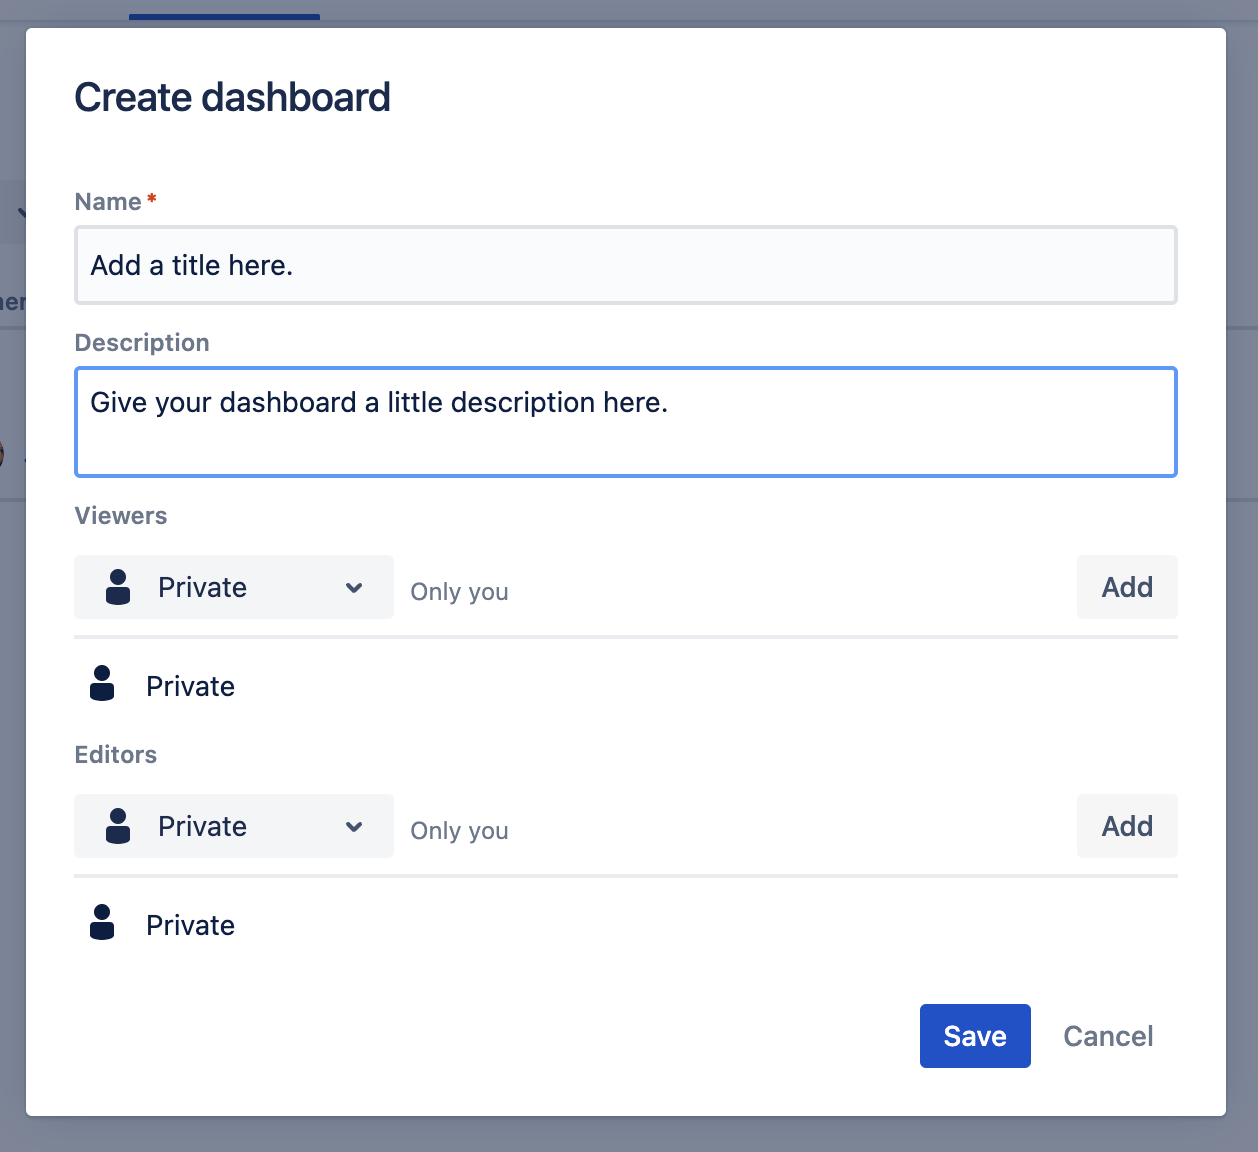
To create a new dashboard page:
- Click on “Dashboards.”
- Select “Create Dashboard.”
- Name the dashboard and add a description.
- Fill out the remaining fields on the dashboard page.
- Don’t forget to click “Save.”
Then, when a new dashboard is created, they can begin to create custom Jira dashboards.
Adding a Gadget to Jira Dashboards
Once a new dashboard has been set up, users can add charts, tables and more using highly customizable features in the form of Jira gadgets.
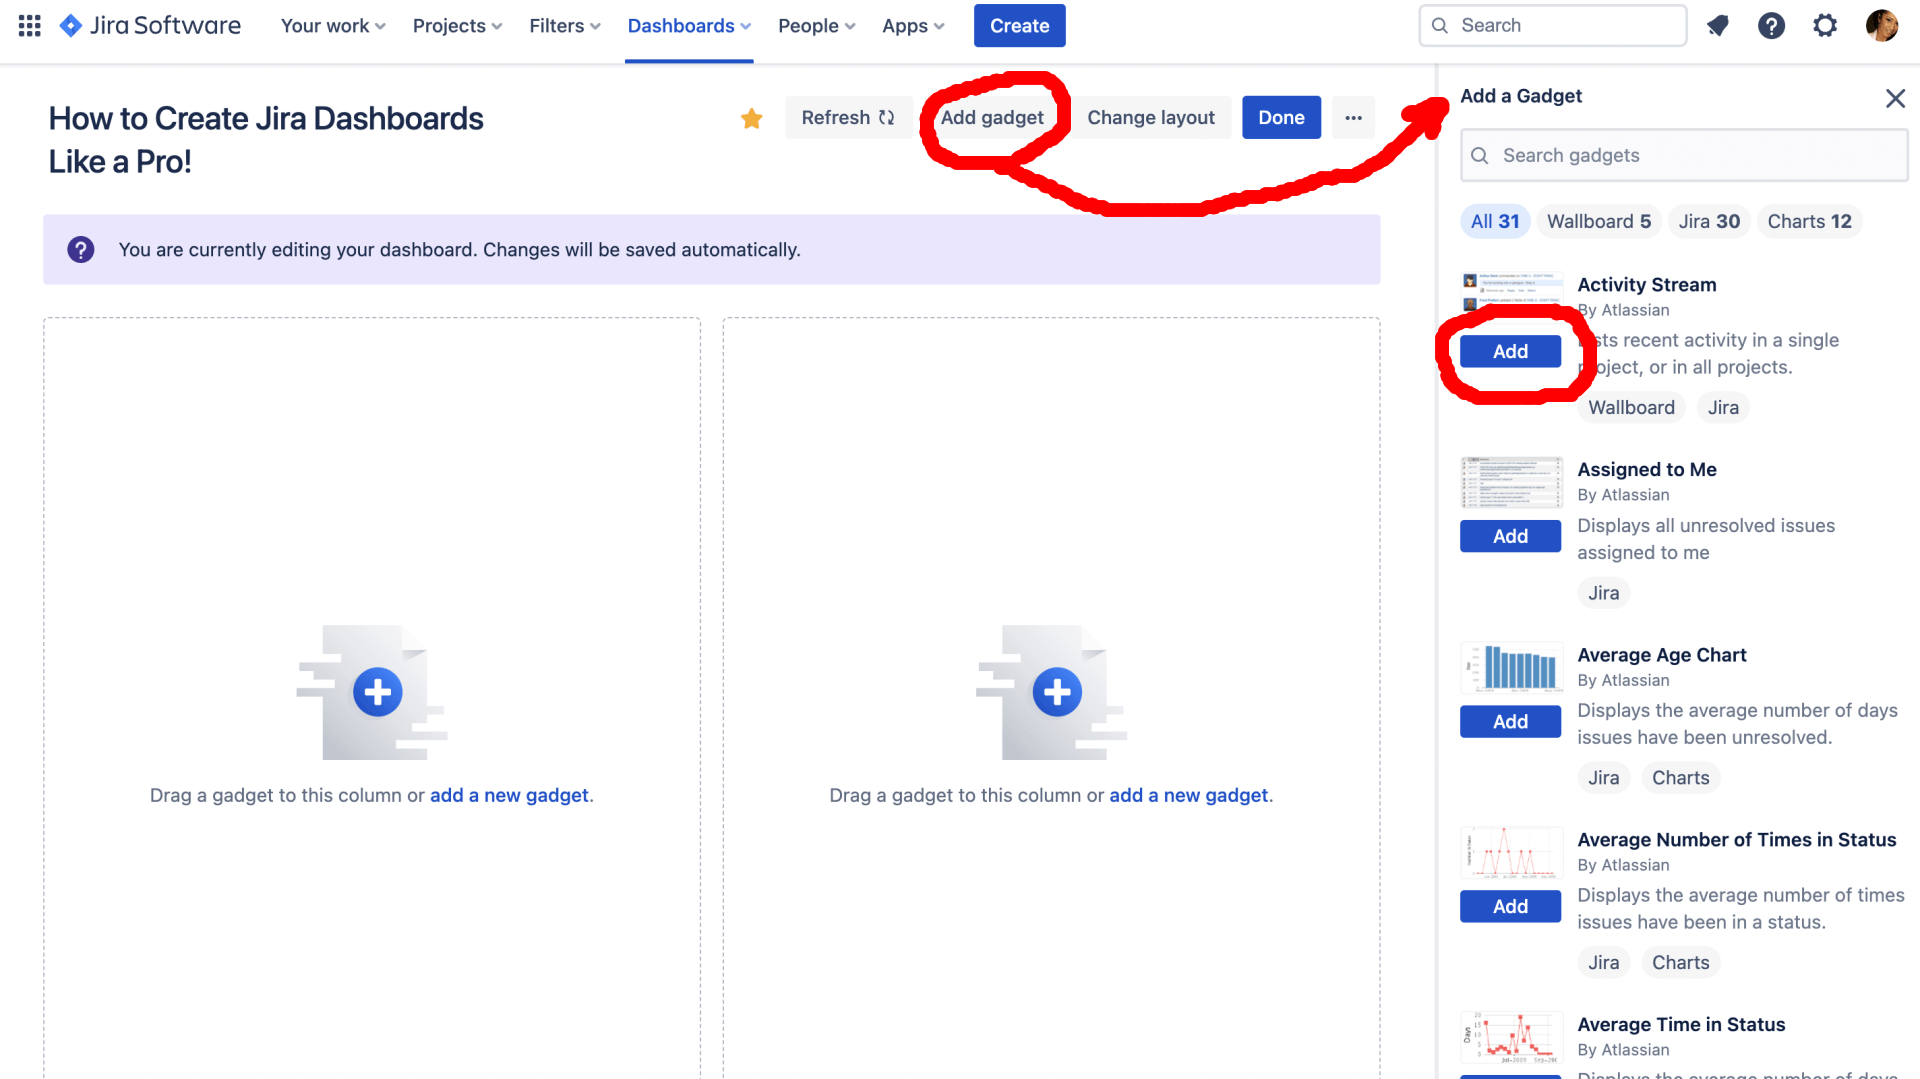
To get started using gadgets:
- Make sure to sign in as an Admin.
- Click “Add Gadget” on the top right of the dashboard page.
- If no “Add Gadget” button is visible, click on “Edit“ button and find “Add Gadget“ here.
- Choose from the available Jira Dashboard gadgets.
- Drag and drop gadgets to arrange them into columns.

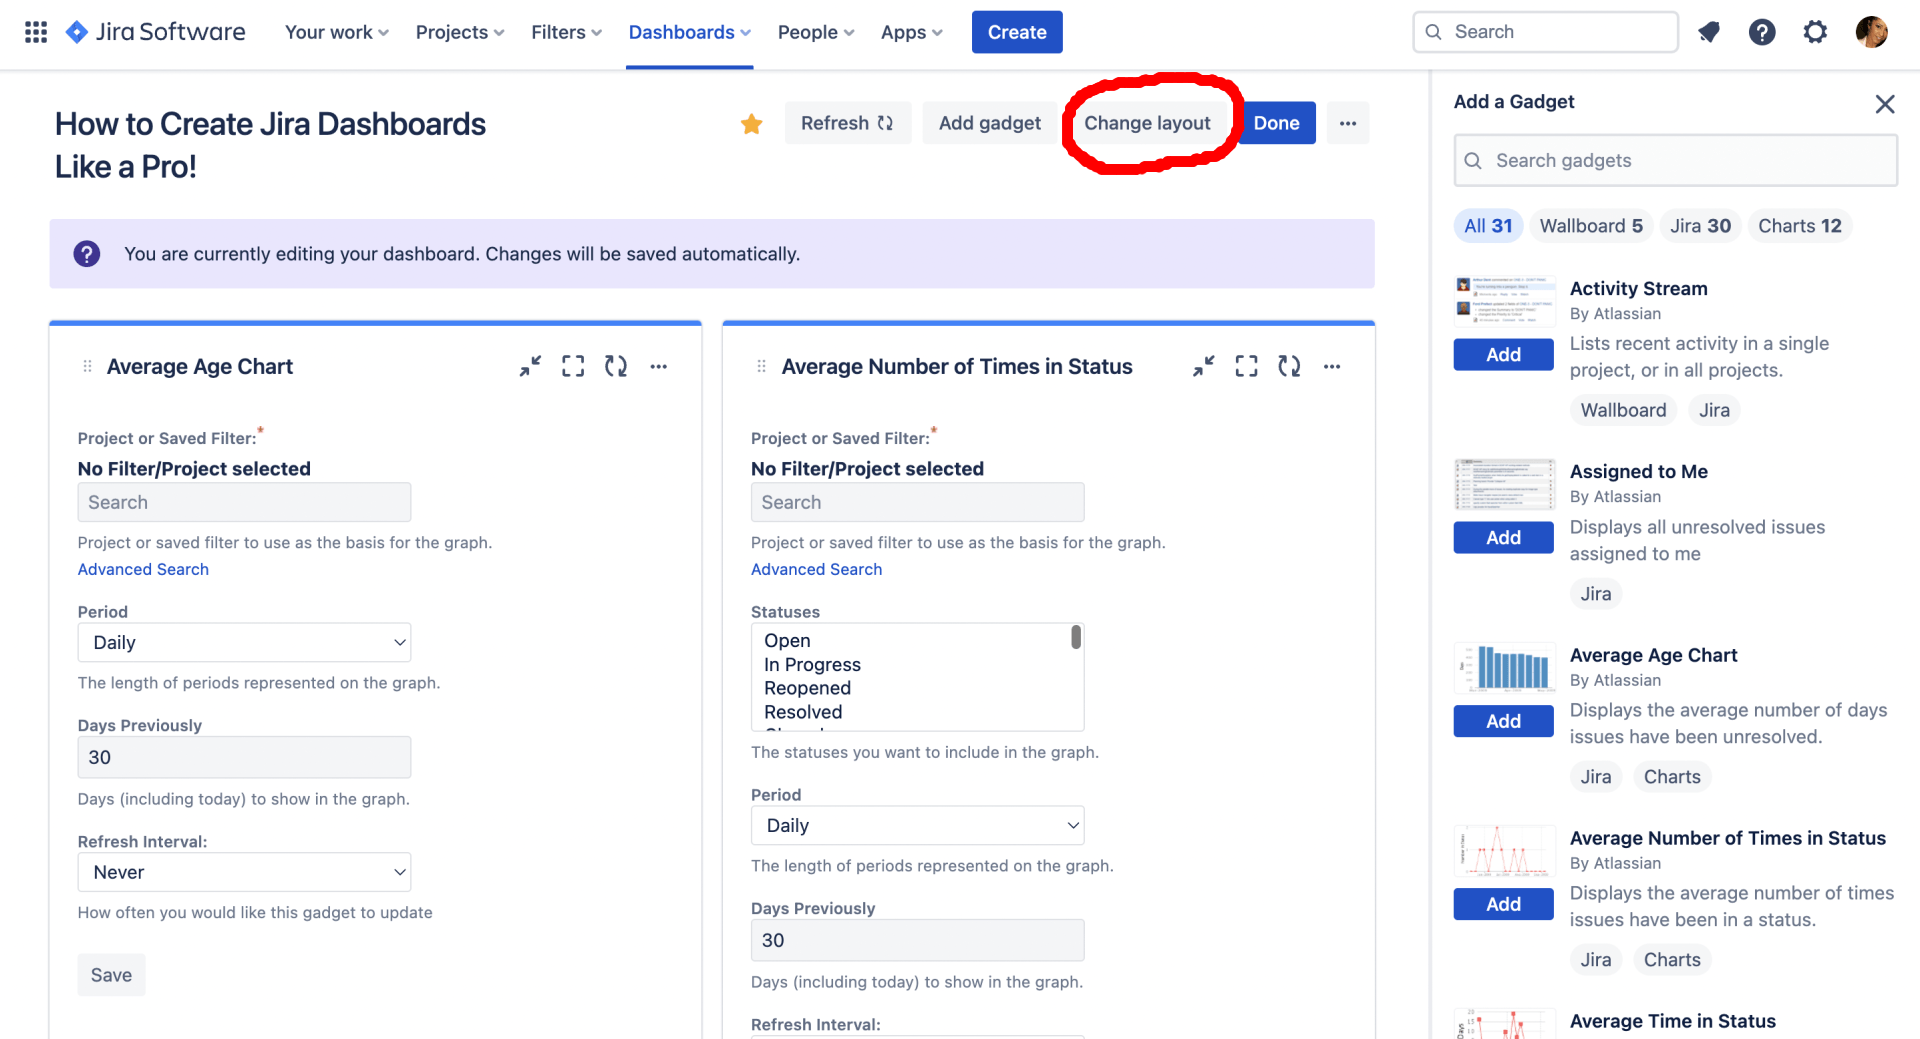
To display a list of all projects for quick and immediate access, users often opt to include the projects gadget:
- Choose “Dashboards”
- Select “View all dashboards.”
- Scroll to the dashboard’s name, then click “Change Layout.”
- Select the preferred layout and add the project gadget.
One really cool thing about Jira is that it promotes collaborative planning. Project managers can customize their dashboards using a mix of reports and gadgets that allow teams to gather and analyze data at first sight. Then, through visualization, developers will learn more about each stage of the SDLC and will be able to plan according to this insight.
For the most part, Jira dashboard gadgets were meant to display the summaries of project-related milestones, progress and issues in a single dashboard. But if appropriately configured, users can customize these gadgets to display key details regarding critical tasks and activities and data associated with specific team members.
Similar to Jira’s reporting mechanisms, there are an endless number of gadgets available on the market. However, there are a few popular gadgets that teams will use almost every time.
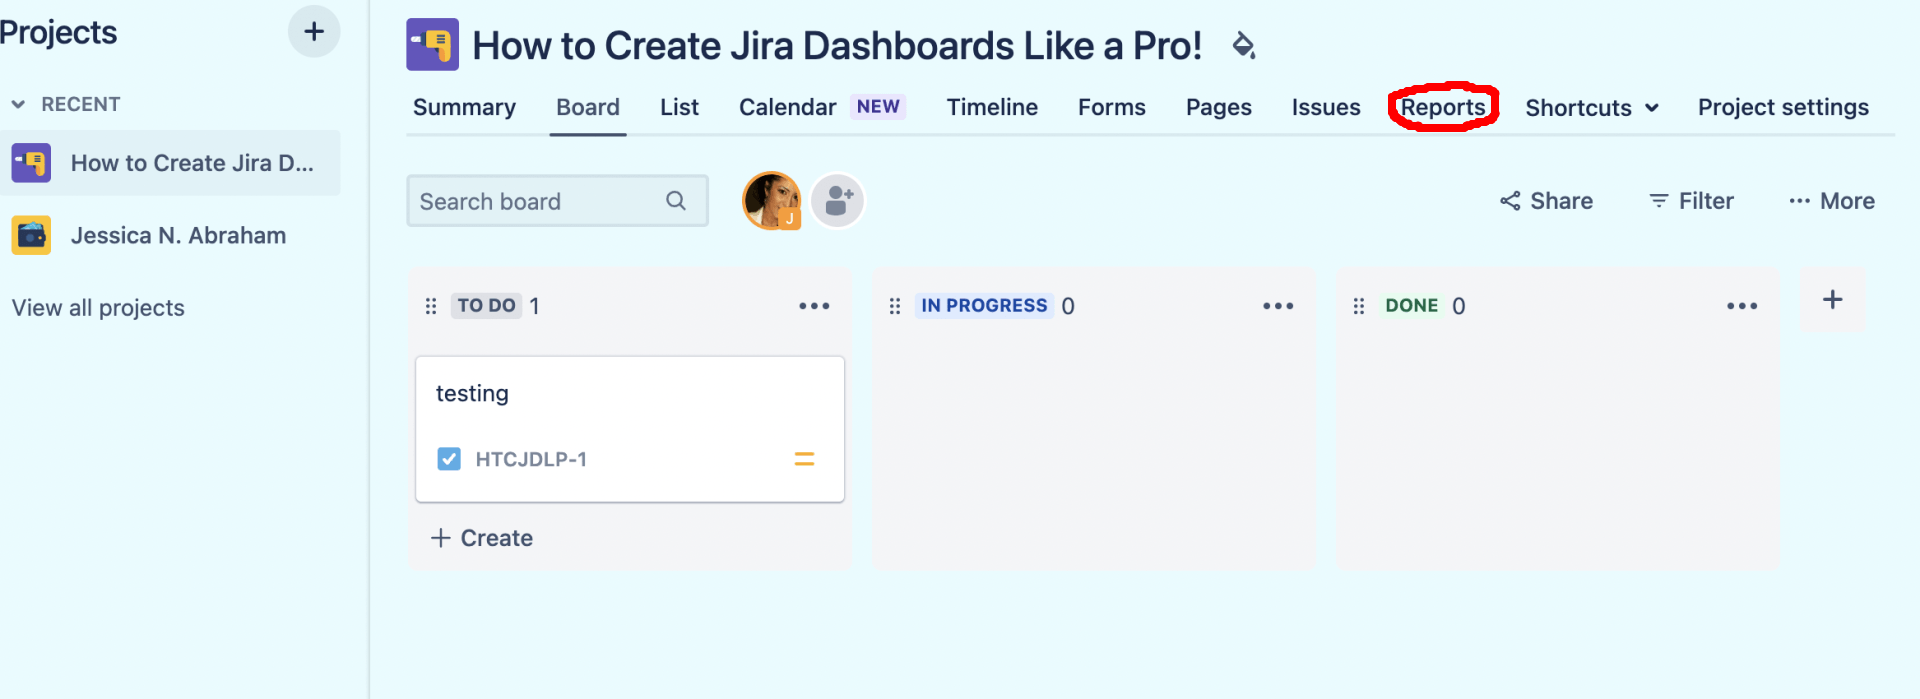
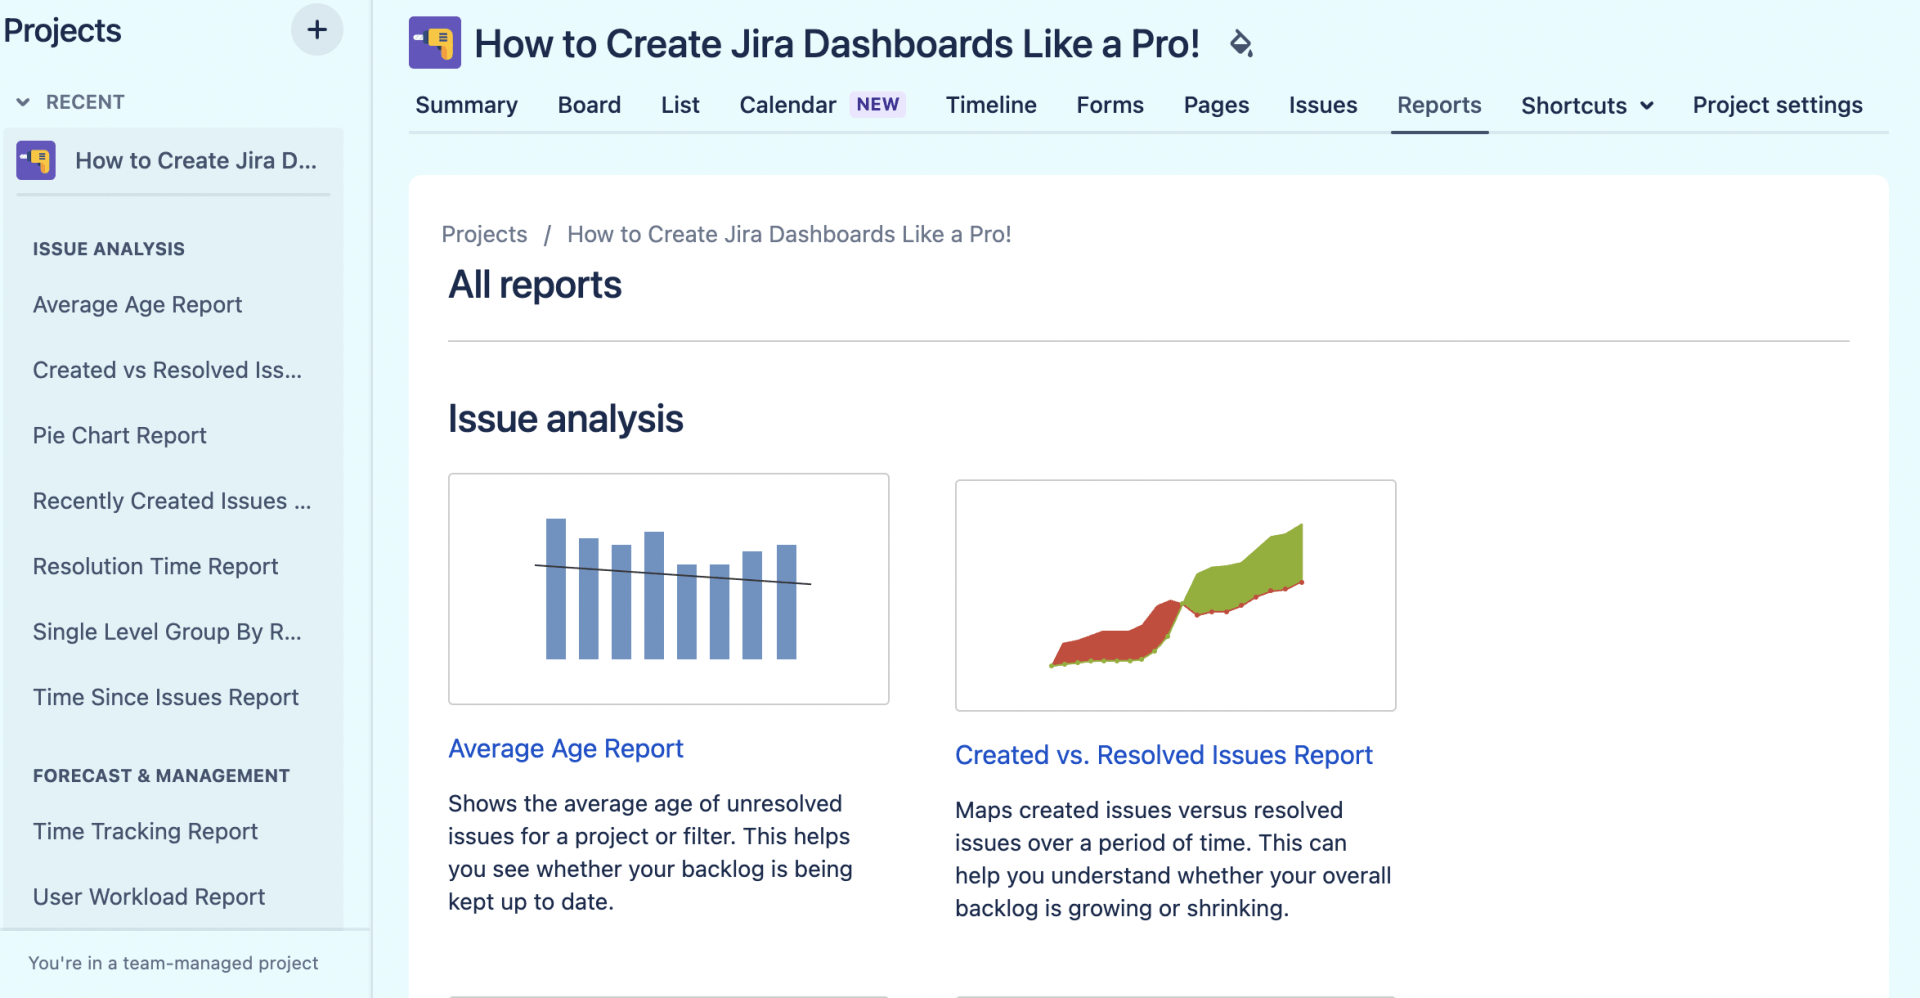
To Generate a Report:
- Navigate to the project that seeks reporting.
- Select “Reports” in the project sidebar.
- Generate a report from the reports overview or the project sidebar.
- View the list of reports for the details of each report.
Popular Jira Dashboard Gadgets:
- Sprint health gadget
- Agile sprint burndown gadget
- Filter results gadget
- Two-dimensional filter statistics gadget
- Pie chart gadget
- ‘Assigned to Me’ gadget
- Query gadget
- Chart gadget
- Issue statistics gadget
- Velocity chart gadget
The Sprint Health Gadget
Jira’s Sprint Health gadget allows the most relevant metrics of any project to be compiled in between sprints, allowing teams to quickly determine whether a project is heading for trouble, if there’s a chance for excessive creep or if the team is experiencing overcommitment. This particular gadget is generally nestled on the top-left of most dashboards to encourage total visibility among members operating each sprint.
The Sprint Burndown Gadget
The Sprint Burndown gadget allows teams to track the status of ongoing sprints and predict whether or not the team will finish its work in time based on estimation. Its simple interface shows how much work has been completed, which work remains between sprints and any changes made across scope. Project managers can then assess each sprint based on how quickly each task is being carried out and the number of tasks completed on time. Huge dips in the diagram may be translated to project overload or that tasks were not evenly distributed between team members.
Filter Results Gadget
Using the filter results gadget, users can make a JQL statement to detect issues under the “Flagged” field. It displays mission-critical matters in the top right corner of the screen. Users can also create filters that allow them to search for project-related data and narrow down their search for particular issues that relate to very specific software components. Various components can be assigned a status, which will also allow users to quickly find this data, including filters that have been marked with “favorite.” In fact, those marked with “favorite” will be displayed directly on the dashboard page itself.
The Two-Dimensional Filter Statistics Gadget
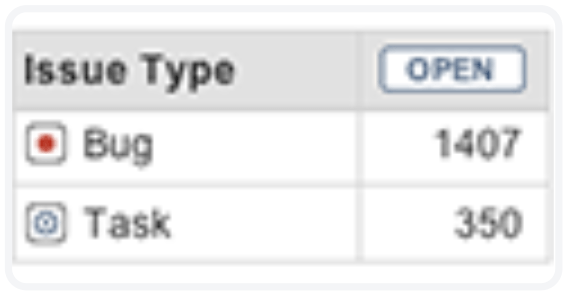
Data can be configured into a split dataset and displayed in two convenient tables, so critical areas of a project can more easily be spotted. Users can quickly identify work completed and remaining work while prioritizing the activities that need the most attention. The two-dimensional (2D) filter shows statistical data in selecting a specific issue filter, including statistical data relating to closed issues, completed projects and more. This data can then be compared using onboard metrics and parameters to gain much deeper insight.
The ‘Assigned to Me’ Gadget
The ‘Assigned to Me’ gadget allows users to assign work to one another between each sprint session, which has proven critical to users who face difficulty with certain assigned tasks and encounters that hold them up from the rest of the process. When faced with challenging situations, users can assign difficult tasks to others who may have more experience in that particular area without overloading them beyond their means. This not only cuts back on bottlenecks faced in daily workflow, but it also minimizes those risks and issues holding the project back from production.
Pie Chart Gadget
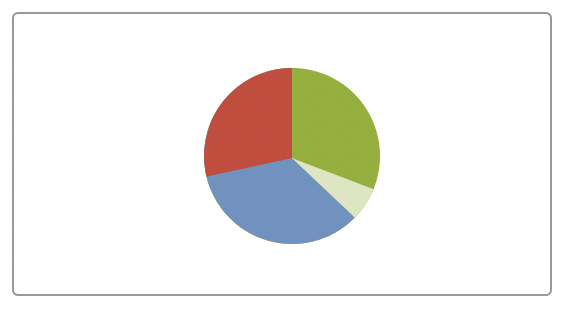
The Pie Chart gadget allows the most critical user data to really stand out. Using precise criteria, this colorful gadget populates data into an onboard pie chart, allowing users to create and assign labels, gauge the progress of each project, understand interdependencies and focus on issues waiting to be corrected.
Query and Chart Gadgets
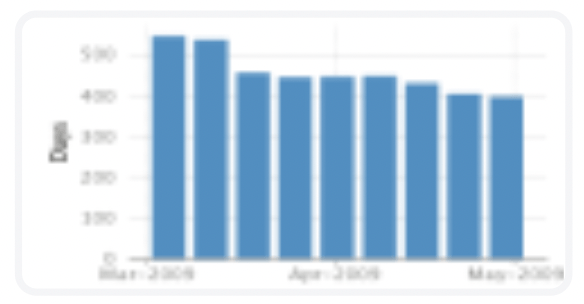
Unlike the others on this list, chart and query gadgets aren’t standalone gadgets relating to a specific project or user data. Instead, they are two different gadget types that display information relating to certain queries or datasets that further elaborate on the details provided within other gadget types. Query gadgets, for example, display a list of searches and queries related to data found in other areas of the Jira dashboard. In addition, chart gadgets can be customized to present the data found in other gadgets and evolved to visualize progress over time.
Velocity Chart Gadget
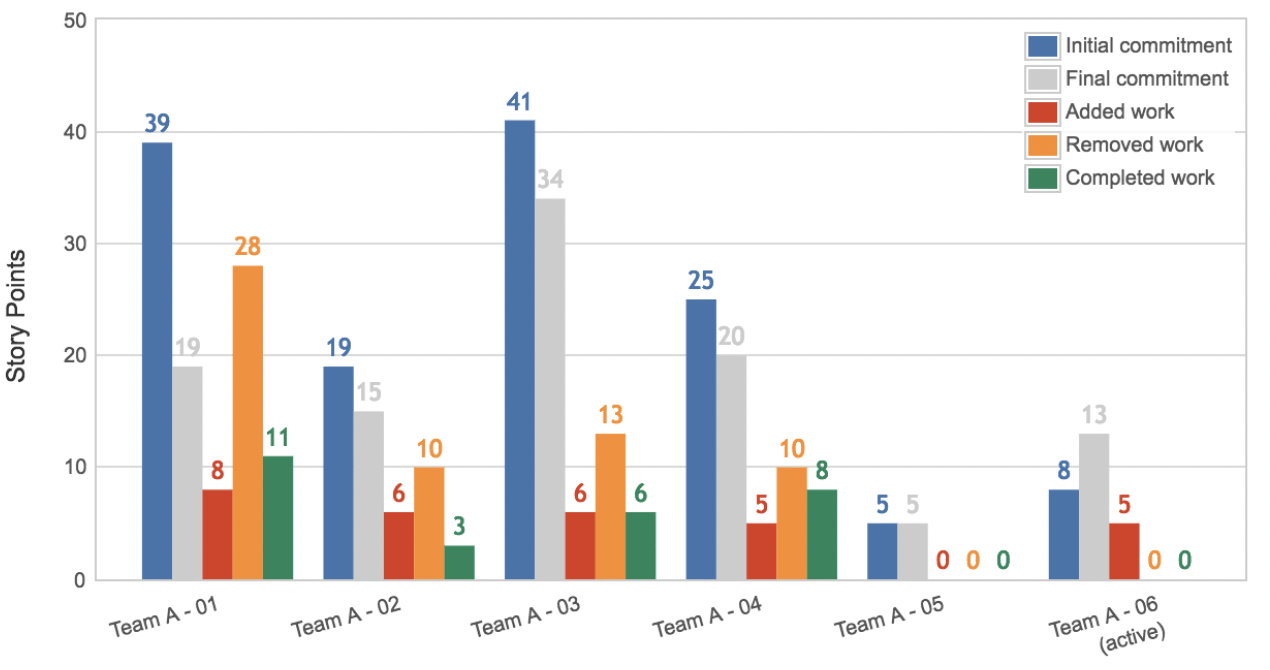
Although this gadget is meant for use over time, the velocity chart gadget uses the power of velocity planning to track work from sprint to sprint and to help teams determine how many milestones can realistically be achieved between sprints. Over time, the data will become accurate as project managers apply estimation methods to planning future sprint events.New Paragraph
Issue Statistics Gadget
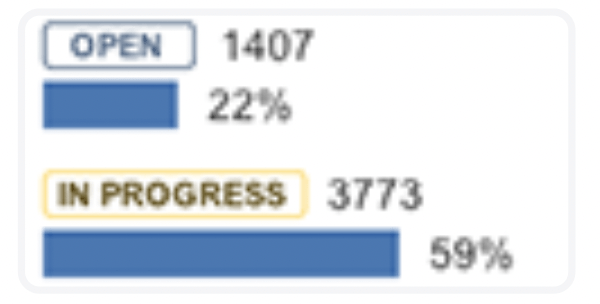
The Issue Statistics gadget splits and displays issues based on a particular filter. Data is presented based on percentages. Issues can be filtered based on how many items each team member is responsible for, the skillsets necessary for particular activities, how much of the project is complete and how much of the project is left altogether.
A few ways managers can use this data to:
- Better identify key bottlenecks either now or in the future
- Tell whether or not someone has too much on their plate
- The possibility of deprioritizing activities
- Understand how well someone would do taking on more challenging tasks in addition to those already assigned
- Identify which skill sets are necessary to complete certain tasks
- Assess which members of the team are equipped to carry out more specialized tasks
- Differentiate whether the team needs additional training or if they should hire new team members
The Unfortunate Problem with Jira Dashboards
Although Jira, on its own, is an amazing tool for capacity planning, managing development efforts and issue tracking, the reality is that in today’s environment, it just isn’t enough, especially for large-scale enterprises and full-time software development firms.
When there are large teams at play — or when multiple teams are at work simultaneously — communication and transparency become major factors. Most developers in this scenario will be left to work independently or to provide microservices, and they will need to track their own sprints and builds throughout the software development lifecycle.
Automation is one of the most significant advantages a company can have on its side. Larger sets of data can be compiled and even analyzed. Data can be prioritized, and issues can be resolved much faster, leaving little room for delays and human error.
Teams benefit from productivity — and very often, this comes with growing out the DevOps toolchain. But flipping between screens and dashboards simply isn’t the answer. These programs need to be streamlined. They need to be able to communicate with one another. Too many dependencies stem from something as minor as someone forgetting to update a status or being unsure if it’s still in progress because of another.
There’s no room for manual processes, including data entry or reporting.
Using Jira Dashboards Alone Can Become Quite Costly
While there are limited, free versions of Jira available for teams of 10 or smaller, even the basic necessities just aren’t there.
Users, for example, can only participate in basic roadmapping and dependency management. There are no features for capacity planning, no granularity for user roles or permissions, no guaranteed uptime, no audit logs and only community support is available to those in need. Reporting is limited, and storage remains at the bare minimum for free account users.
A majority of the most essential tools and metrics are basically missing. And even with a fully-upgraded, enterprise-level account, it can become quite costly, especially for enterprise-level teams, to get more out of their data — even with an enterprise-level account.
As mentioned earlier, a number of enterprise-level needs will often go unmet when using a Jira dashboard as a standalone platform. On top of this, additional team members will need to be hired as Jira admins to manage and maintain a system that still requires regular input from the development team. And no matter how much planning goes into a service — paid or unpaid — certain limitations are inevitable and must be addressed accordingly.
6 Critical Insights Engineers Can’t Get From Jira Dashboards Alone
There’s no other way to say it. Jira dashboards are really an excellent tool for project and issue tracking, as well as for capacity planning. And in fact, it has evolved into a de facto system dashboard for engineering leaders.
However, when looking at the entire DevOps lifecycle, there are still several key insights and metrics that are either extremely difficult or impossible to get from Jira. In fact, it limits the 360-degree visibility that engineering leaders need to make critical decisions on the fly. And unfortunately, there are a few factors we need to take into account when making the decision to adopt one program over another, as is the case with managing large-scale software development teams.
Here are six key insights that you cannot get from a Jira Dashboard today:
- End-to-end cycle time accuracy (Lead time to change)
- SDLC bottleneck definition
- Deployment of scope
- Code hotspots
- Alignment metrics between teams
- Early risk warning on sprint slips
Accurate End-to-End Cycle Time and Lead Time to Change
It can be extremely difficult to measure lead time, especially in Jira. Lead time is the time between the initial stages of development and when the product is actually delivered to the customer.
In Jira, the timer officially “starts” once a developer is assigned a task, and its status is changed to “in progress.” The problem is that most people forget to keep these activities updated, so they’re prone to operator delay and error. It can also create a whole lot of backlog due, even if the work has already been completed. Next steps are often measured based on the change in Jira, as dependencies closely follow behind.
With a continued delay, teams begin to experience misguided cycle times, and the total cycle from start to finish starts to become unclear.
To combat this, cross-tool reporting needs to become a major priority for project leadership. Because, at best, teams will use three or more different platforms and dashboards. Maintaining cycle times means that developers must be super diligent and place process hygiene at front row and center. This can be very time consuming and also quite expensive.
SDLC Bottleneck Definition
To identify bottlenecks or learn the true status of a pull request, there must be a highly granular level of traceability across various phases of the SDLC.
Users must decide:
- Where is the majority of time being spent?
- Which work items are being held back, and why?
Unfortunately, these types of answers won’t come from a Jira dashboard alone. And as a matter of fact, it can become an arduous and very tedious process just tracking an item through these switchbacks and across different systems to identify whether or not it’s truly stuck, where it’s being held up and the reason for the hold up in the first place.
Multiple platforms are likely in use. The lack of real-time integration between them further complicates the situation.
Data from one app is not automatically updated in Jira, inadvertently allowing more than one external pull request to correlate with a single Jira ticket. This can make it even harder to trace and harder to differentiate between logs and events that belong to a single pull request, which ones were committed and which ones were merged.
Given the dynamics, automating these processes can become very challenging. It can require the manual development of complex rules and conditions that don’t always translate between multiple dashboards.
Although automation does exist with Jira, there are still a number of processes that must be carried out manually, whether that means transferring data in and out of apps, marking various processes with an updated status or moving parts of the project along to the next steps.
We still need to input metrics, switch between programs that carry out specific tasks, migrate data between platforms and program each platform for those different tasks.
The time it takes to both gather and maintain a well-curated database and program Jira to do many of these tasks, even at a basic level, is equivalent to employing two-to-four full-time engineers at a mid-sized organization.
Code Hotspots
Code hotspots are areas of code that frequently produce defects, and they can happen for any number of reasons. The most common of which stems from poorly architected and poorly designed code. But in order to mitigate these changes, it’s necessary to identify any fundamental changes and to quickly determine the risk factors associated with each of these changes over time.
Plotting code hotspots is the ultimate Excel nightmare.
In order to identify issues in the code, additional data will need to be pulled from external ticketing systems. Data relating to specific code modules will also need to be extracted from Jira.
Unfortunately, Jira’s ticketing systems don’t have a reputation for being well-groomed. And information is, more often than not, missing about code modules that may have been impacted by change.
Alternative measures can be taken to identify these code modules. It will require multiple pull quests and activities to be analyzed manually between several different platforms. Needless to say, it’s a very complex job that requires special attention. It can also be highly time-consuming.
These could result in poor user experiences, such as with slow response times or bugs. Developers often spend a considerable amount of time working to solve code hotspots, ultimately hindering the team’s overall productivity.
Metrics Alignment Between Teams
Jira has made it easy for teams to collaborate and for there to be some sort of alignment between project management and software development teams. However, what’s missing may be just as important as what’s included.
There needs to be a way to evaluate:
- Whether particular processes have been adhered to
- How much of the information was provided
- Whether this is an ongoing issue — does it need to be addressed, or is it a “one-off?”
Is the data telling a story? When measuring how well project management teams align with software development teams, it’s important to not only address where the project has been but also where it’s going. The project’s roadmap must be made visible — and both long and short-term plans must be made accordingly.
Teams should adhere to strict guidelines and avoid shifting priorities that lead to derailed efforts that can impact development time, quality and delivery. Unfortunately, this is something that Jira currently doesn’t do too well.
Early Warning of Risk on Sprint Slips
Although sprint and story point data can be saved into Jira, there’s no obvious way to quantify risk, a factor that could provide an early indication of slippage and failure ahead of time. Furthermore, a lack of automated controls and risk-based predictors translates to no reasonable way of monitoring or being alerted to risks as they unfold in real-time. And while customization is an option, no amount of tracking or adherence to strict processes and governance will provide sufficient enough insight.
Something as simple as creating too many story points — or an imbalance of story points — can easily cause slippage. Not being able to correlate a weighted score to those story points can also make a difference. Some may take low effort, while others may be ultra-intensive. This imbalance can quickly add to more slippage.
A highly intuitive software-as-a-solution (SaaS) tool, Propelo quickly integrates with over 40 different SDLC tools, including Jira, GitHub, Azure DevOps and Jenkins, to compute DORA and over 100 other insightful metrics within just days of deployment.
Dive deeper into the “6 Insights Jira is Not Giving You” by clicking here, and learn how the two platforms complement one another when leading engineering teams to excellence.
While you’re at it, check out Atlassian for everything you need to know about Jira Dashboards, including customizable templates, reports and system dashboard gadgets.


